Sunday, June 14, 2020

Root password of a Docker container

Root User Privileges in a Docker Container


Often we will come across situations where the default user setting in docker container will be not be sufficient to perform operations. 

Lets say to kill a process, inspect or edit some system files, import certificates or even to install some tool..


We have few options to accomplish this..


Easiest of all:

docker exec -u 0 -it <container-name> bash
 
By default, "0" denotes root user. You can also choose to specify, simply as "root". Also its better to specify the working directory as below..

docker exec -u root -it --workdir / <container-name> bash


Other options that are available are during the container image build:

Make necessary file permissions, etc., during the image build in the Docker file

If all the packages are available in your Linux image, chpasswdin the dockerfile before the USER utility

Hope this helps..!!

10 Useful Unix Commands - Must for Debugging


Useful Unix Commands for Debugging with Examples


This is my list of commands, found useful while debugging issues in logs, servers process, etc., With regard to the list, will share the commands which I use in the real world scenarios..

  • lsof - Used to get the list of "open files" in linux and all the processes that opened them. I find them useful to search / find the processes that are listening on a given Port.          
            lsof -i tcp:8443

This will give the Process ID, service name which listens on the port (8443) and much more.. Particularly useful to debug different services running on the same server. 

Saturday, June 13, 2020

Kubernetes Certification - CKAD


CKAD - Certified Kubernetes Application Developer 


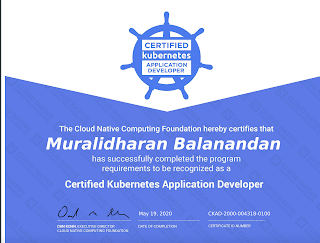
Recently I cleared the CNCF - Cloud Native Computing Foundation's certification - CKAD - Certified Kubernetes Application Developer (YES.!!!)


If you haven't explored Containers - Docker, Kubernetes, the whole cloud native journey, would request to start now.. Its much fun.. 


CNCF offers two certifications on Kubernetes (K8s), CKAD for Application Developers and CKA for DevOps / Administrators. 

CKAD is a real hands-on, performance based exam for a duration of 2 hours. 
The curriculum covers Core Concepts, Configuration, Observability, Pod Design patterns, Networking, persistence and other concepts.

Multiple trainings are available through the official Linux Foundation trainings, Udemy, Pluralsight, etc.,

My favourite been Mumshad's following Udemy course, covering all the concepts needed for the certification. Also the training course in Linux Foundation covers the concepts in much more depth. 

Apart from the concepts, one has to be really good with Linux command line / terminal commands and environment. During the test you will be presented with multiple clusters and traversing through them needs skill. 
Also brush up your vi editor commands since you will be required to write .yaml files for the K8s configurations. 


Finally, one important recommendation - Practise, Practise and More Practise... 

Few resources that would help..


Last tip, Try to containerise your legacy applications, learning apps (anything that you can put hands on) and deploy them in K8s using minikube in your development environments. This will help...


CKAD

Onboard the Cloud Native wagon.. All the best for your efforts..
Happy coding..!!

Wednesday, December 13, 2017

WSO2 ESB - How to track messages between mediation flows

WSO2 ESB Services / APIs for Enterprise level applications, usually consume services deployed in other WSO2 products like DSS, BRS etc., or use services deployed in some legacy or third party application (can call, backend services) in order to complete the service request.

This means you have multiple endpoints configured and used, across different sequences encomposing the service.

Keeping track of these internal message flows between various services is important to debug service flows. This is more important and complex when debugging services which involves service timeouts and client or backend service errors.

Thankfully, as per the WS-Addressing specification, each message is assigned a unique message identifier or Message ID.
Synapse Engine takes care of the same and every Message is assigned an unique message ID.

Its available as MessageID and its a Synapse context message property that can be retrieved using the get-property() function in the Property mediator.

<property name="msgID" expression="get-property('MessageID')"/>

Its makes our world better... 😁
But wait...

For a sample flow like the following, the MessageID will vary across different integration points like ESB ↔ DSS, ESB ↔ TPL Application, etc.,


Sample service flow

This brings us to the core of the issue, how to track the message from the client Request (1) to the ESB and then subsequent calls to DSS services, backend services, etc., and finally the Response to the client.

This can be handled in a simple way as follows: 


1. Read the MessageID from the incoming client request through property mediator and assign to a custom property, say msgID.
      <property name="msgID" expression="get-property('MessageID')"/>

2. Log the custom property across different sequences and debug statements, as follows.

    <log level="custom">
        <property expression="get-property('msgID')" name="***MESSAGE_ID***"                       xmlns:ns="http://org.apache.synapse/xsd" xmlns:ns2="http://org.apache.synapse/xsd"/>
    </log>


This will enable tracking the entire message or service flow using a single MessageID

From a reusability and code quality standpoint, you can have these common log statements in a separate sequence and include this sequence in other In or Out sequences.
This will also be useful to maintain these sequences in Governance Registry.


Happy Reading..!!!


Tuesday, November 28, 2017

WSO2 ESB - Disable Endpoint Suspension


Endpoints

An endpoint in simple terms is a URL (destination) that can be used by any WSO2 service which needs to send a message to that particular destination / API. 

The endpoints can be configured for both external services and also internal, peer services running inside the same ESB instance or the host system. 

One of the important configurations that is often overlooked are the endpoints error handling. 
As any network oriented application, messages can get lost due to various tcp errors, connection timeouts, etc., Therefore for a successful and controlled behavior, endpoint error handling is very important. 

The default behavior of endpoints in WSO2 is, if messages in those endpoint are failed, the endpoint will be marked as "suspended" and thereby causing failure of the subsequent messages. 

This is more important if multiple internal services are consumed as part of an exposed Proxy service or API. To handle the different errors and timeouts from the internal services and thereby control the response and errors to the end client, its important to manage the errors of endpoints.


Few important configurations are listed out here and a working sample configuration.

Configurations:

"timeout" settings: 

duration - Connection timeout interval. If the service doesn´t respond by this time, the endpoint will be marked as "Timeout" state. In Timeout state, the endpoint can still send or receive messages but if the error continues, the endpoint will be marked as "suspended". 

responseAction - When a response is received to a timed out request, this parameter specifies whether to discard it or to invoke the fault handler. The default value is none

Sample Configuration

The following sample configuration can be used to completely disable the enpoint suspension behavior of the endpoints. 

Configure the Timeout, MarkForSuspension and suspendOnFailure settings as shown in the below configuration for the same.

<endpoint xmlns="http://ws.apache.org/ns/synapse" name="service_ep">
    <address statistics="disable" trace="disable" uri="http://localhost:9765/services/stores_Operation">
        <timeout>
            <duration>20000</duration>
            <responseAction>fault</responseAction>
        </timeout>
        <markForSuspension>
            <errorCodes>-1</errorCodes>
        </markForSuspension>
        <suspendOnFailure>
            <initialDuration>0</initialDuration>
            <maximumDuration>0</maximumDuration>
            <progressionFactor>1.0</progressionFactor>
        </suspendOnFailure>
    </address>
</endpoint>

Tuesday, October 31, 2017

Explore Endeca Workbench Architecture and embedded applications


Explore Endeca Workbench - Apache Sling Web Console


Oracle Commerce 11.2

Workbench is an hybrid web application, housing the Experience Manager (XM), EAC console, Data sources (CAS crawls) etc., providing the bunch of capabilities for business users and also the content and system administrators to configure and administer the Endeca application. 

The Endeca workbench application is made up of other well known technologies and applications like Apache Sling, a framework for RESTful web-applications, Apache Jackrabbit, a content repository complying to the JCR API, Apache Felix, etc.,

In this blog we can have a look at the Apache Sling configurations and capabilities that are exposed and available for fine tuning.

Apache Sling

Simply put, Apache Sling is a framework for RESTful web applications, mapping HTTP request URLs to content resources based on the request's path, extension, etc.,
You can have a deep dive on Sling at the above link...

Apache Sling application exposes the configuration parameters, packaged bundles, exposed services, log support and other monitoring features through the Web Console.

Through the Endeca Workbench application, Apache Sling Web Console can be accessed, providing a gateway for controlling and monitoring many important Sling features.

Web console path:
http://<host>:<port>/<root_context>/system/console/

Console

The console exposes various capabilities and monitoring features like log support, configuration, installed packages / bundles, memory usage, exposed REST services etc., useful in maintaing and fine tuning the application

Sling Web Console
Apache Sling Web console

Sling Log Support

This screen can be used to control and manage the logging features of Sling, like error level, file rotation etc.,

Sling - Log Support

Configuration

The configuration tab exposes the capability to edit the configurations of various installed bundles (like webdav, etc.,) and other sling configurations like thread pool configurations and much more..


The below Sling Thread Pool configuration will help to fine tune the performance of the Sling module. You can tune threadpool configurations like Minimum and Maximum pool size, Keep Alive Time, priority of the threads, etc.,


Authenticator and RESTful services

In this tab you can review the various RESTful services that are exposed for authenticating services like login, session timeout, logout, etc.,

Services like publishStatus, sessionStatus as the name indicates expose useful services that can be used for any customization. 

Authenticator


Endeca - PublishStatus service response

Endeca - SessionStatus service response

Configuration Status

In the configruation status, various status of components can be reviewed like Memory usage etc.,
Importantly it exposes the Sling.properties file by which you can review the settings available in the file. 

Sling.properties

WebDAV

Apache Sling (JCR based Apache Jackrabbit) supports WebDAV protocal, Web Distributed Authoring and Versioning (a simple protocal based on HTTP, allowing users / clients to do content authoring operations remotely. For more, here).

In the context of Oracle Endeca Workbench, the Workbench application which stores the files in the configuration repository, files like cartridge XMLs, landing pages and other XM configuration files can be accessed directly using a WebDAV client like CyberDuck etc.,

Complete Sling WebDAV features can be referred here.

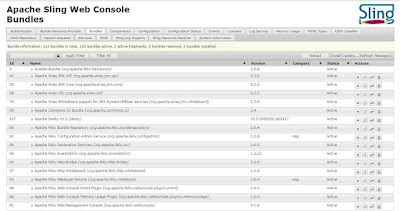
Installed bundles - For Example WebDav support

For complete WebDAV client setup, refer this nice article.

Saturday, October 28, 2017

What is STOMP...

STOMP - The Streaming (or Simple) Text Oriented Messaging Protocol


So, what is STOMP?

Simply put, its a Text Oriented protocol for messaging between two applications or through a message broker. 

Officially it goes, STOMP provides an inter-operable wire format so that STOMP clients can communicate with any STOMP message broker to provide easy and widespread messaging interoperability among many languages, platforms and brokers.

STOMP is text-based and does not use binary protocols. It supports a range of core enterprise messaging features, such as authentication, messaging models like P2P & publish and subscribe, message acknowledgement, transactions, message headers & properties, etc.,

There are number of messaging protocols like AMQP, MQTT, etc., but STOMP stands out as one of the popular messaging protocols which is Text based. 

All leading Messaging brokers support STOMP protocol, for STOMP compliant message brokers refer here.

A nice comparison between leading messaging protocols like AMQP and STOMP, can be found in the following blog.


For further reading:


Root password of a Docker container

Root User Privileges in a Docker Container Often we will come across situations where the default user setting in docker container will be n...